HWWI Commodity Price Index Declines in August
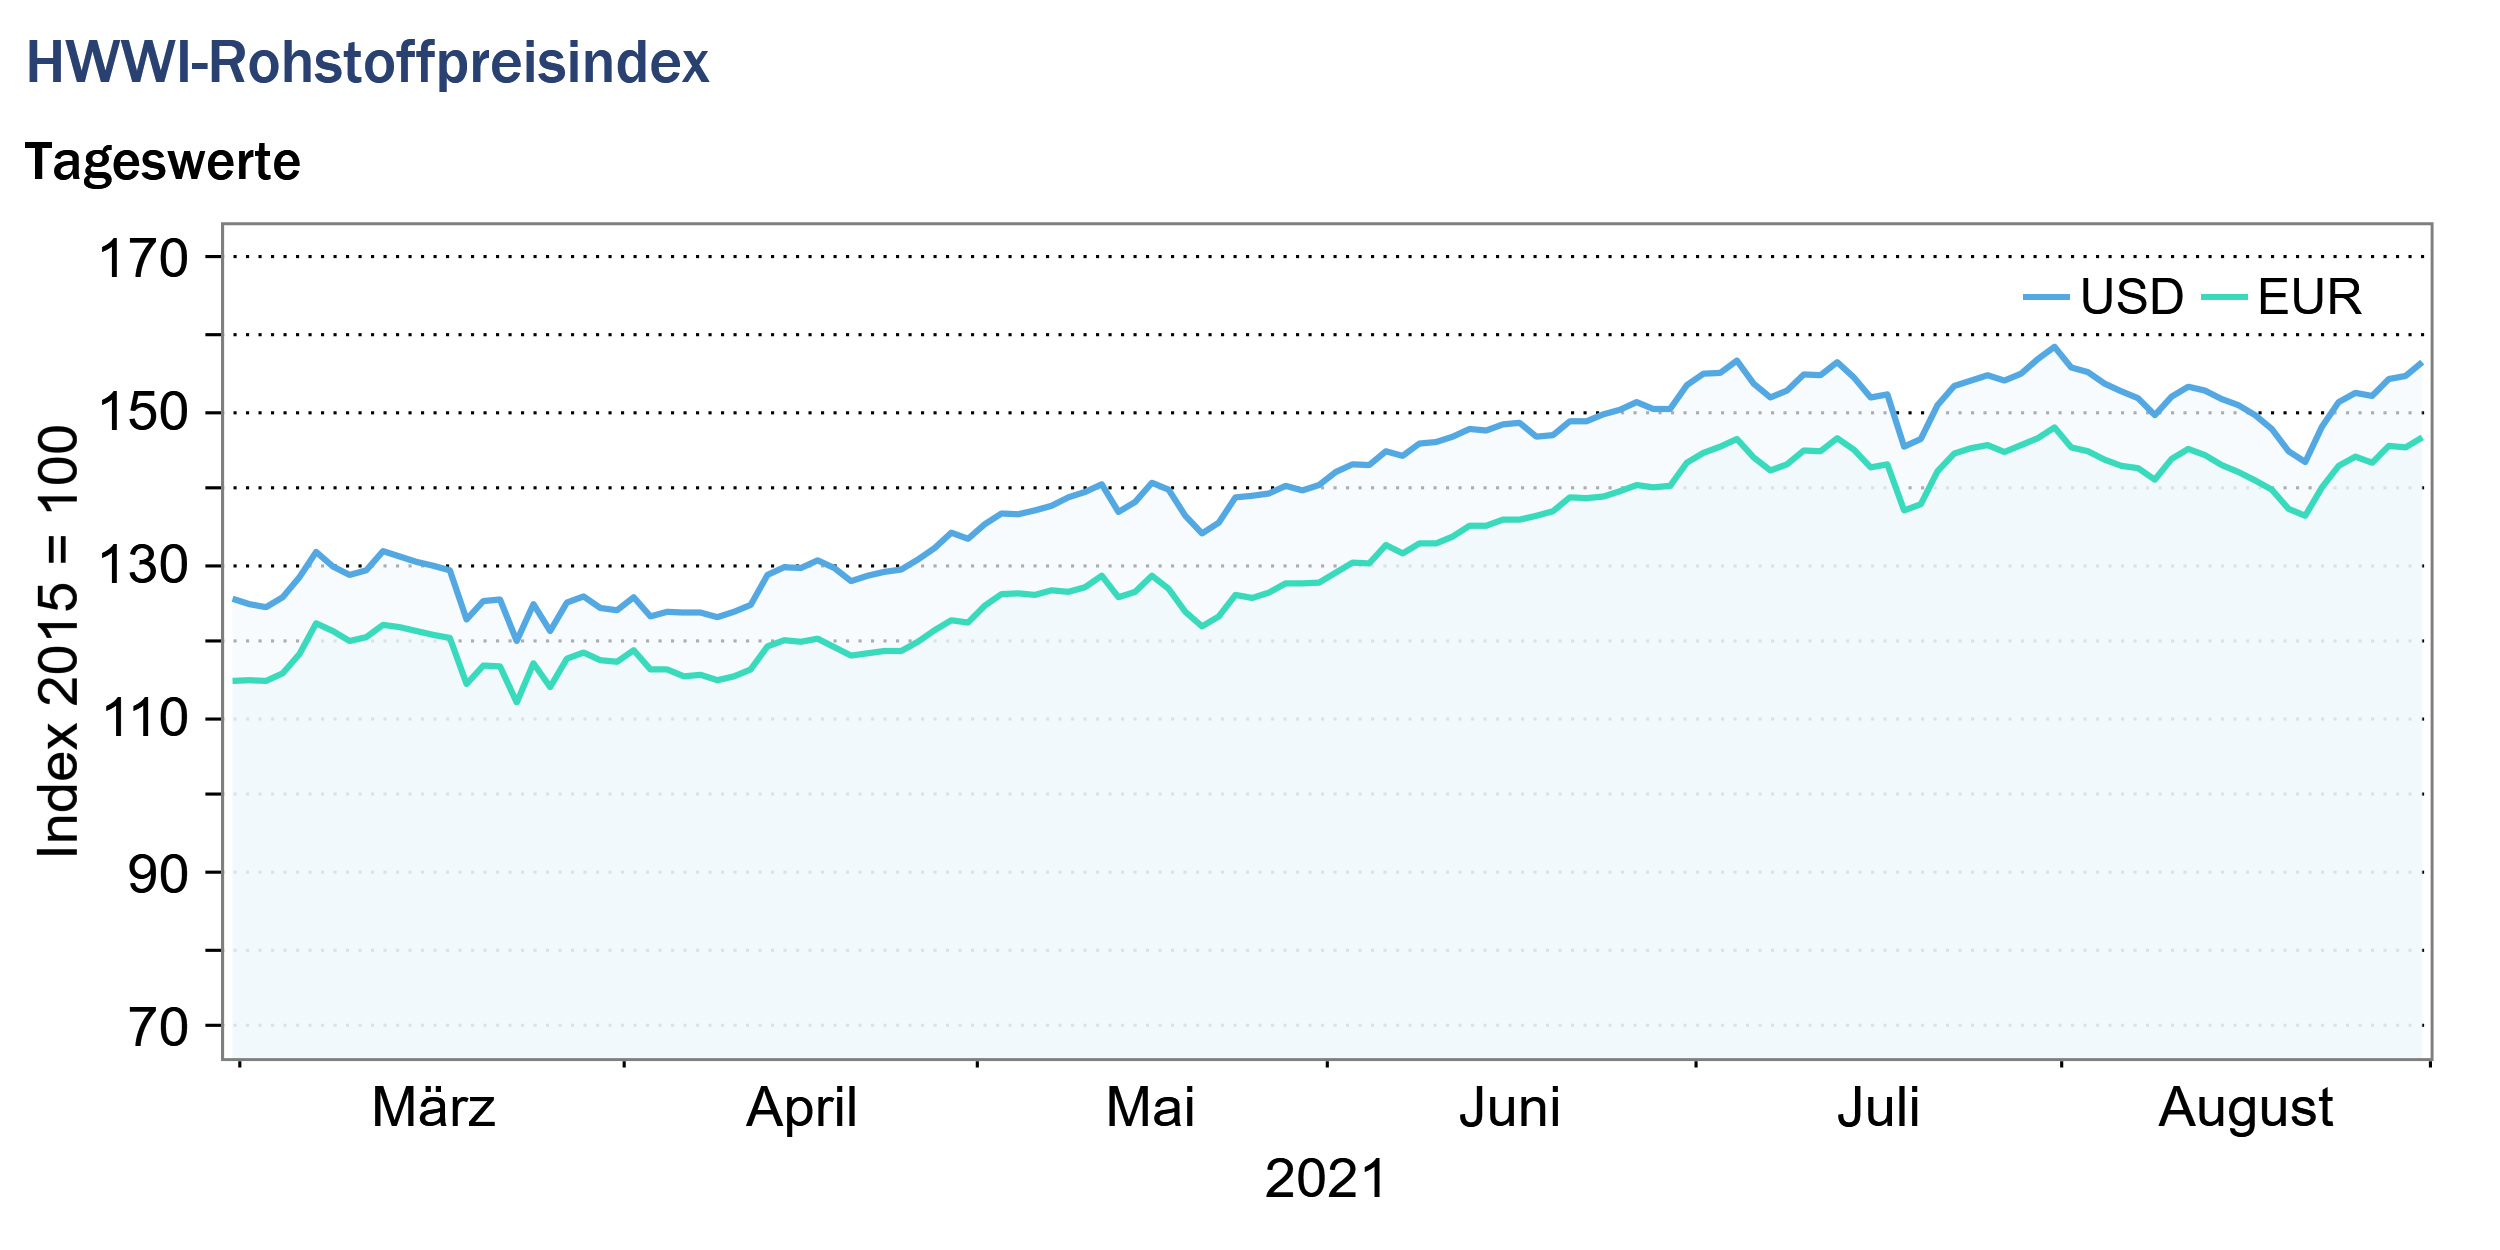
- HWWI overall index fell 1.3% (US dollar basis)
- Crude oil prices fell 5.2%
- Iron ore prices fell 23.5%
(Hamburg, September 13, 2021) The HWWI commodity price index fell by an average of 1.3% in August compared with the previous month and was 72.6% higher than its corresponding value a year earlier. Developments on the commodity markets in August were influenced, among other things, by the renewed rise in infection figures worldwide. The decline in the overall index in August was attributable to falling prices for crude oil and for some industrial raw materials. Prices for coal and natural gas, on the other hand, rose sharply in August compared with the previous month, and some nonferrous metals, such as aluminum, also recorded price increases. The index for food, beverages and tobacco also increased on average in August. In particular, the prices of luxury foods such as coffee and sugar recorded strong price increases in August, reflecting the poor harvest conditions in the growing regions in South America.

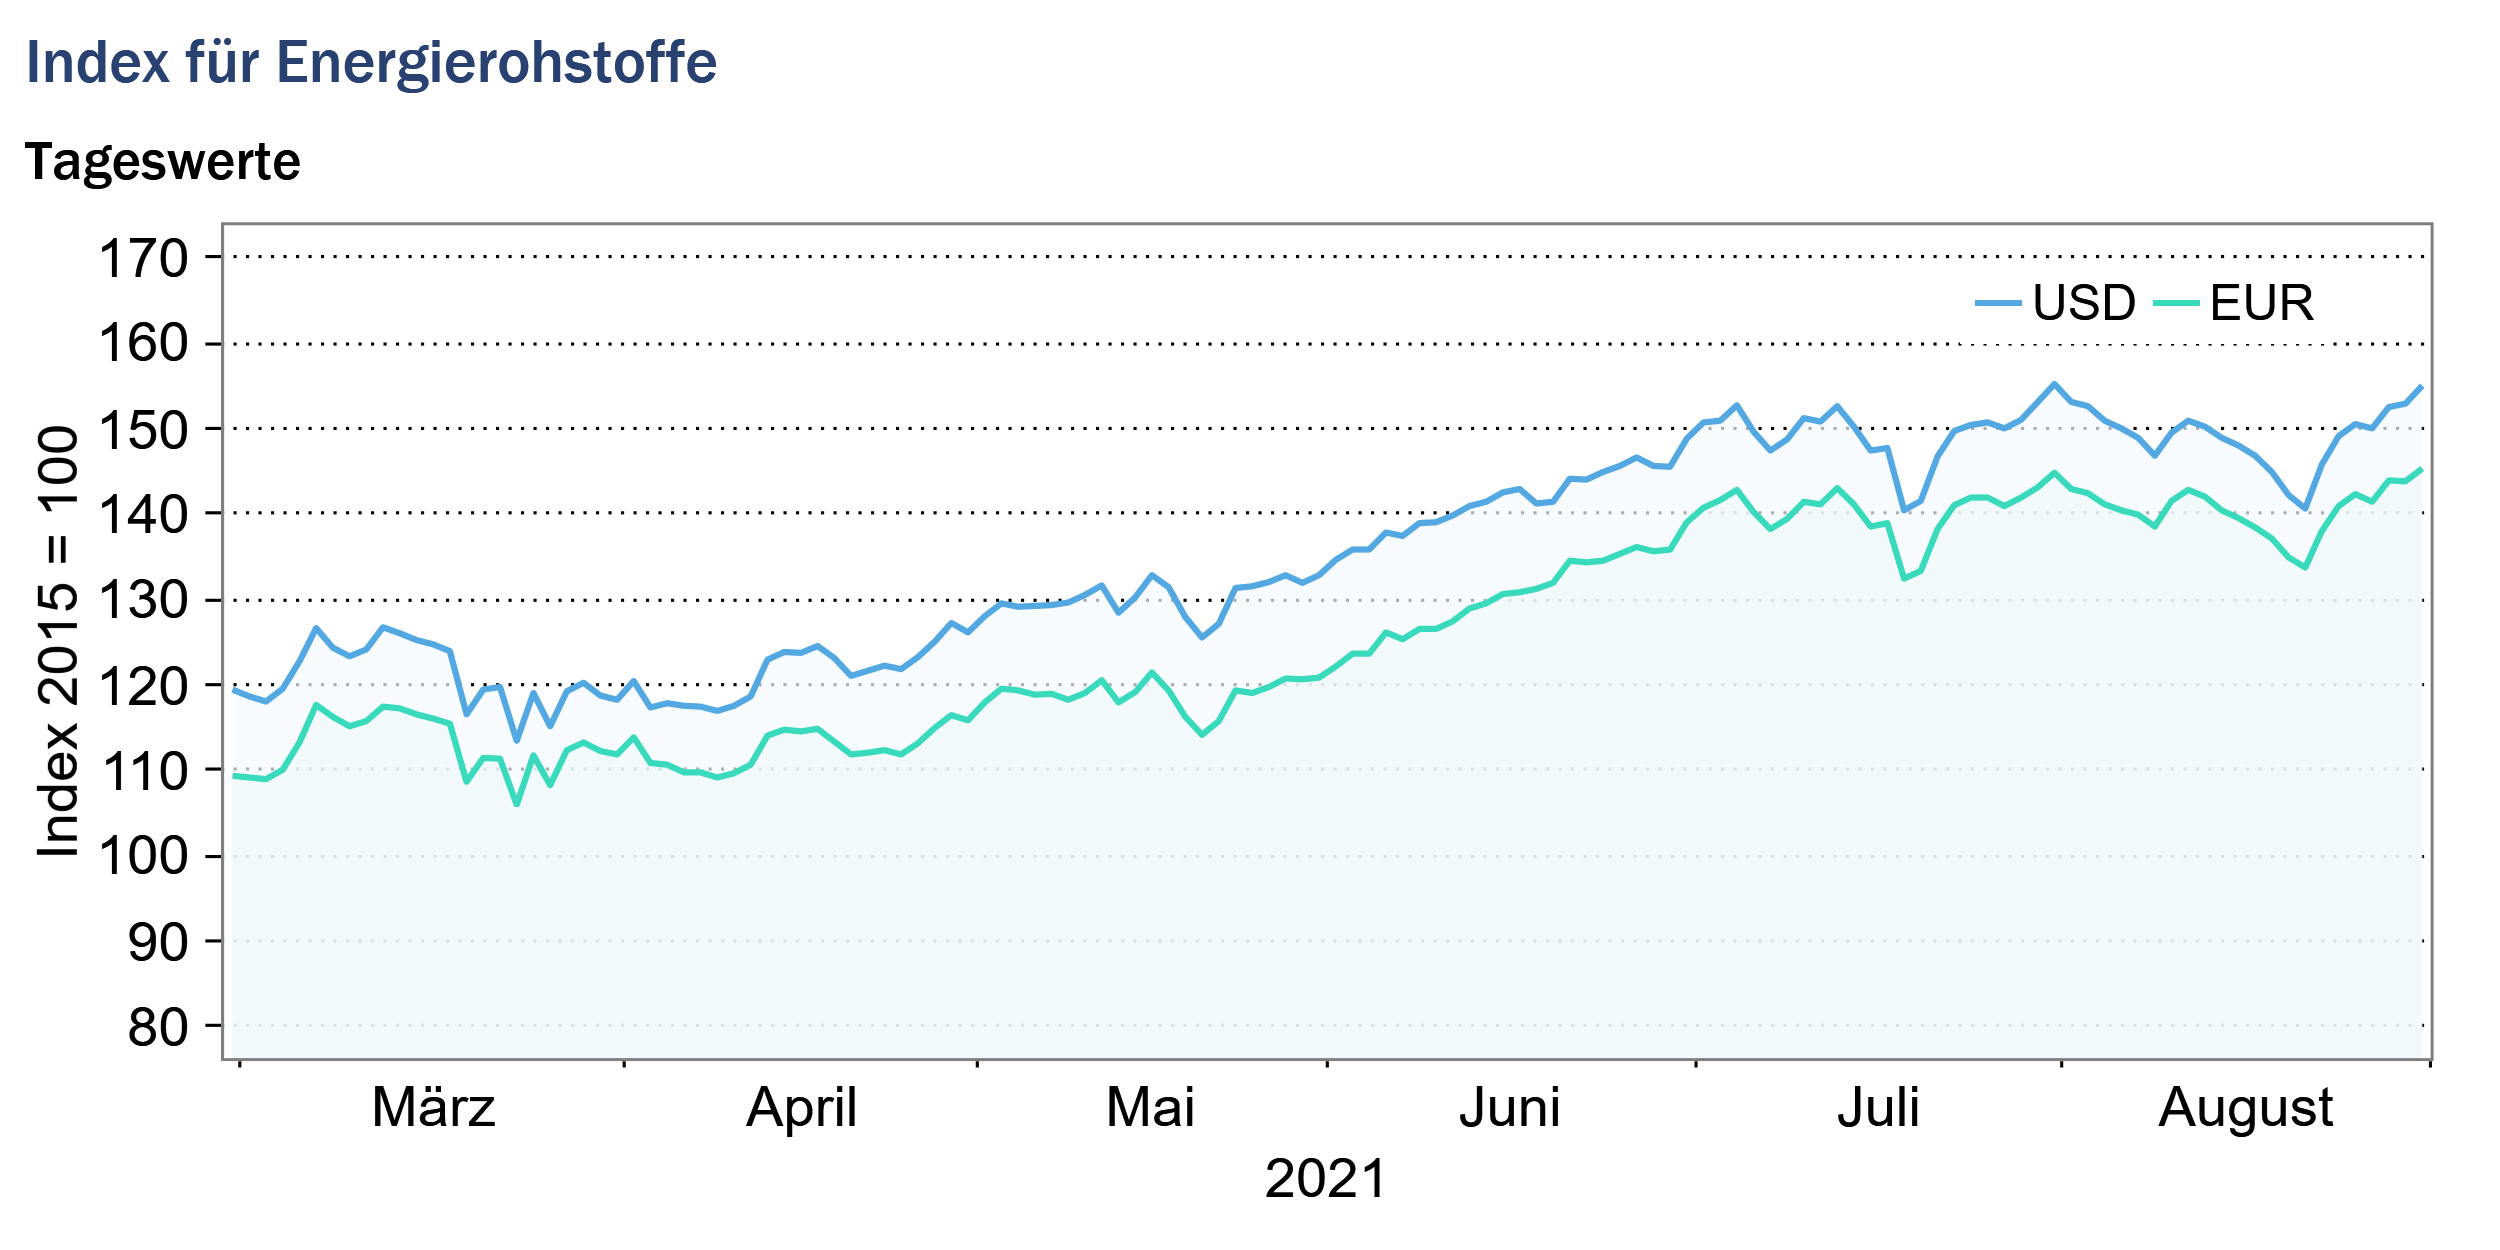
Index for energy commodities: -0.3% (euro basis: +0.2%)
The development of crude oil prices in August was influenced by the global spread of the delta virus variant, especially in China, and by the negotiations of the Organization of Petroleum Exporting Countries including Russia (OPEC+). While the U.S. asked OPEC+ to increase production even more than planned to counter current high gasoline prices, OPEC+ maintained its monthly production increase of 400,000 barrels per day, citing uncertainty about future demand growth due to the spread of the delta virus variant. Crude oil prices for European benchmark Brent fell to $67 per barrel by August 20 and then rose to $72 per barrel by the end of the month. The rise in the last week of August was partly due to China, a major buyer of crude oil, announcing at the end of the month that it had recorded no new local infection figures for the first time since July.
Coal prices, on the other hand, continued to rise sharply in August. While South African coal prices increased by an average of 12.0% month-on-month, Australian coal prices increased by an average of 14.6% for the month. The peak of the Australian coal price in 2008 was thus exceeded for the first time in August. The sharp rise in coal prices was due to increased demand, particularly from China, which continues to meet a weakened supply of coal. Due to a drought in the spring in some regions of China, production at some hydropower plants had to be curtailed, whereupon demand for coal increased. The heat wave in several Chinese regions also led to an increase in demand for electricity for the use of air conditioning. In addition to increased demand, there was also a shortage of supply in August as heavy rainfall flooded coal mines in Indonesia. The Chinese government’s ban on Australian coal imports continues to shift trade routes, also driving coal prices.
While US natural gas prices rose by an average of 5.8% for the month, European natural gas became even more expensive by 24.3% compared with the previous month. As a result, European natural gas prices in August were at a very high level for the time of year and are around five times higher than in August 2020. The high prices reflect the empty natural gas storage facilities in Europe. Due to the long winter, European natural gas storage facilities were already heavily depleted; an increase in demand meant that they could not be refilled in the summer. Depending on how temperatures develop in the coming winter, depleted stocks will continue to be reflected in price increases or supply problems.
Overall, the energy commodities sub-index fell 0.3% (euro basis: 0.2%) to 149.1 points (euro basis: 140.5 points).

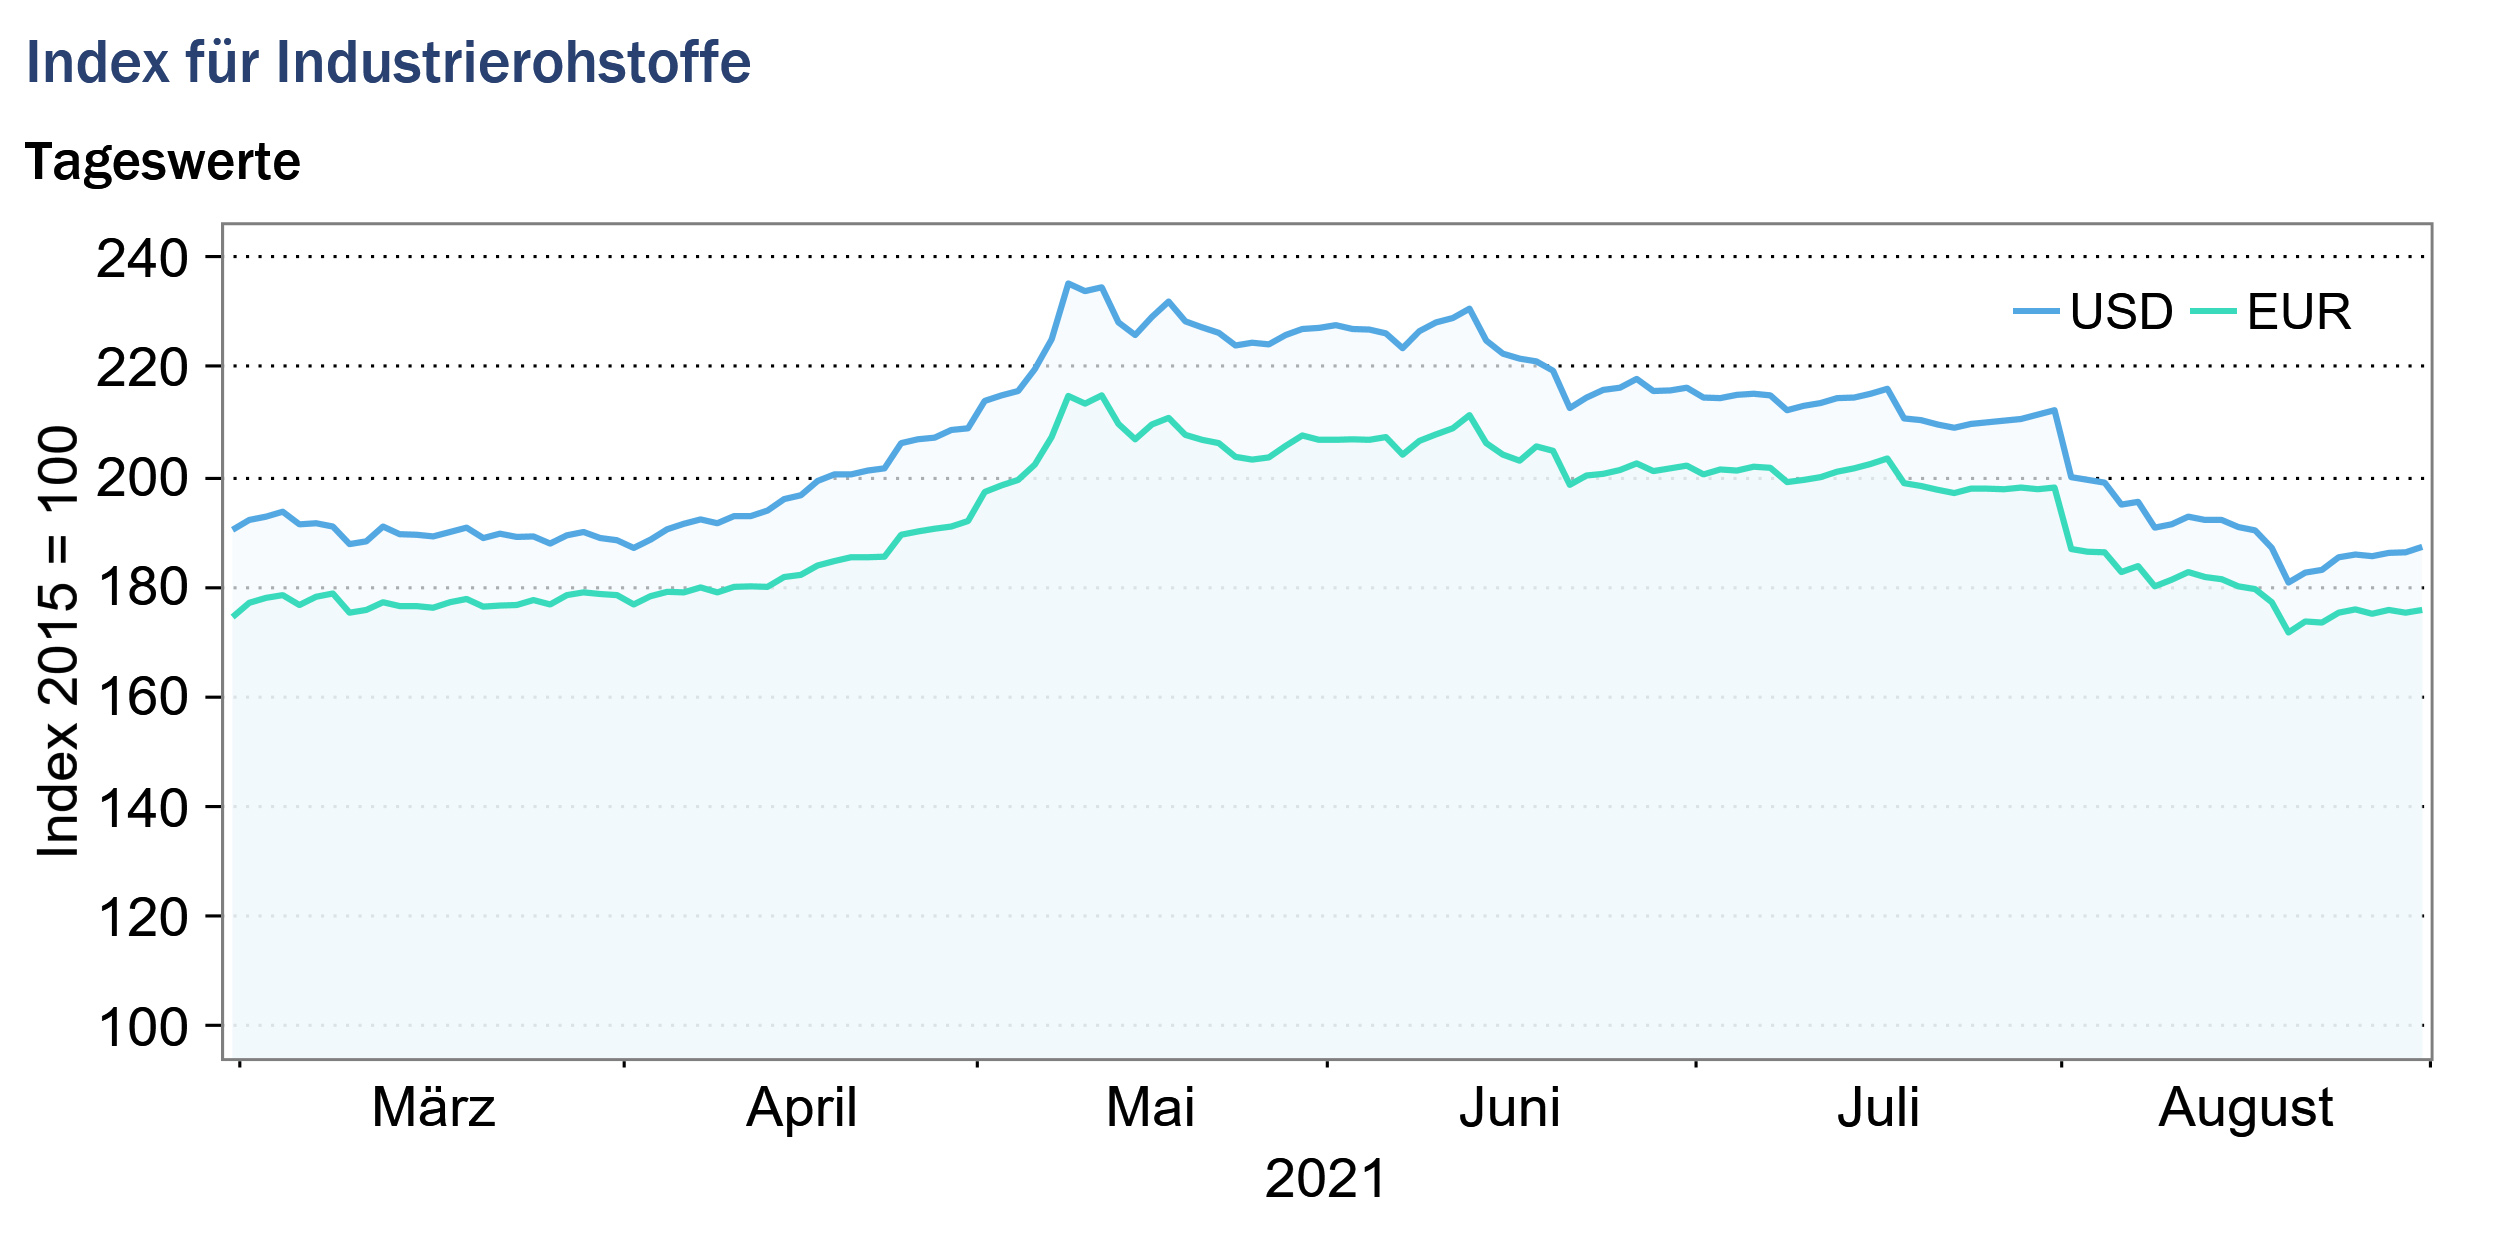
Index for industrial raw materials: -10.6% (euro basis: -10.3%)
The industrial commodities sub-index is divided into the agricultural commodities index, the non-ferrous metals index and the iron ore and steel scrap index.
The sub-index for iron ore and steel scrap fell by an average of 21.8% in August compared with the previous month. The sharp decline was due to the fall in prices on the markets for iron ore. The reason for the decline is the curtailment of steel production in China for climate protection reasons.
On the markets for nonferrous metals, price increases were largely observed in August. Prices for aluminum increased in August compared with the previous month. Increased demand due to ongoing global economic stimulus measures was offset by a decline in supply. In China, some production plants have had to curtail output in recent months due to electricity shortages. In addition, the Chinese government is trying to limit the high-emission production of aluminum to reduce the country’s CO2 emissions. The resulting expected supply shortage on the aluminum market led to an increase in prices, which in August were around 50% higher than the average value for the same month a year earlier. By contrast, the price of copper decreased slightly in August. As a frequently used barometer of economic activity, the lower copper price may indicate increased uncertainty due to the advancing delta virus variant.
In August, the index for agricultural industrial commodities decreased on average compared to the previous month. Lumber prices fell another 29.5% from the July average. After the extreme price increase in May, prices already returned to pre-crisis levels. The world market price for wool was at a historic low in August. The price decline was caused by lower demand due to changes in consumer habits in the fashion industry.
Overall, the industrial commodities index fell by an average of -10.6% (euro basis: -10.3%) to 190.0 points (euro basis: 179.2 points) for the month.

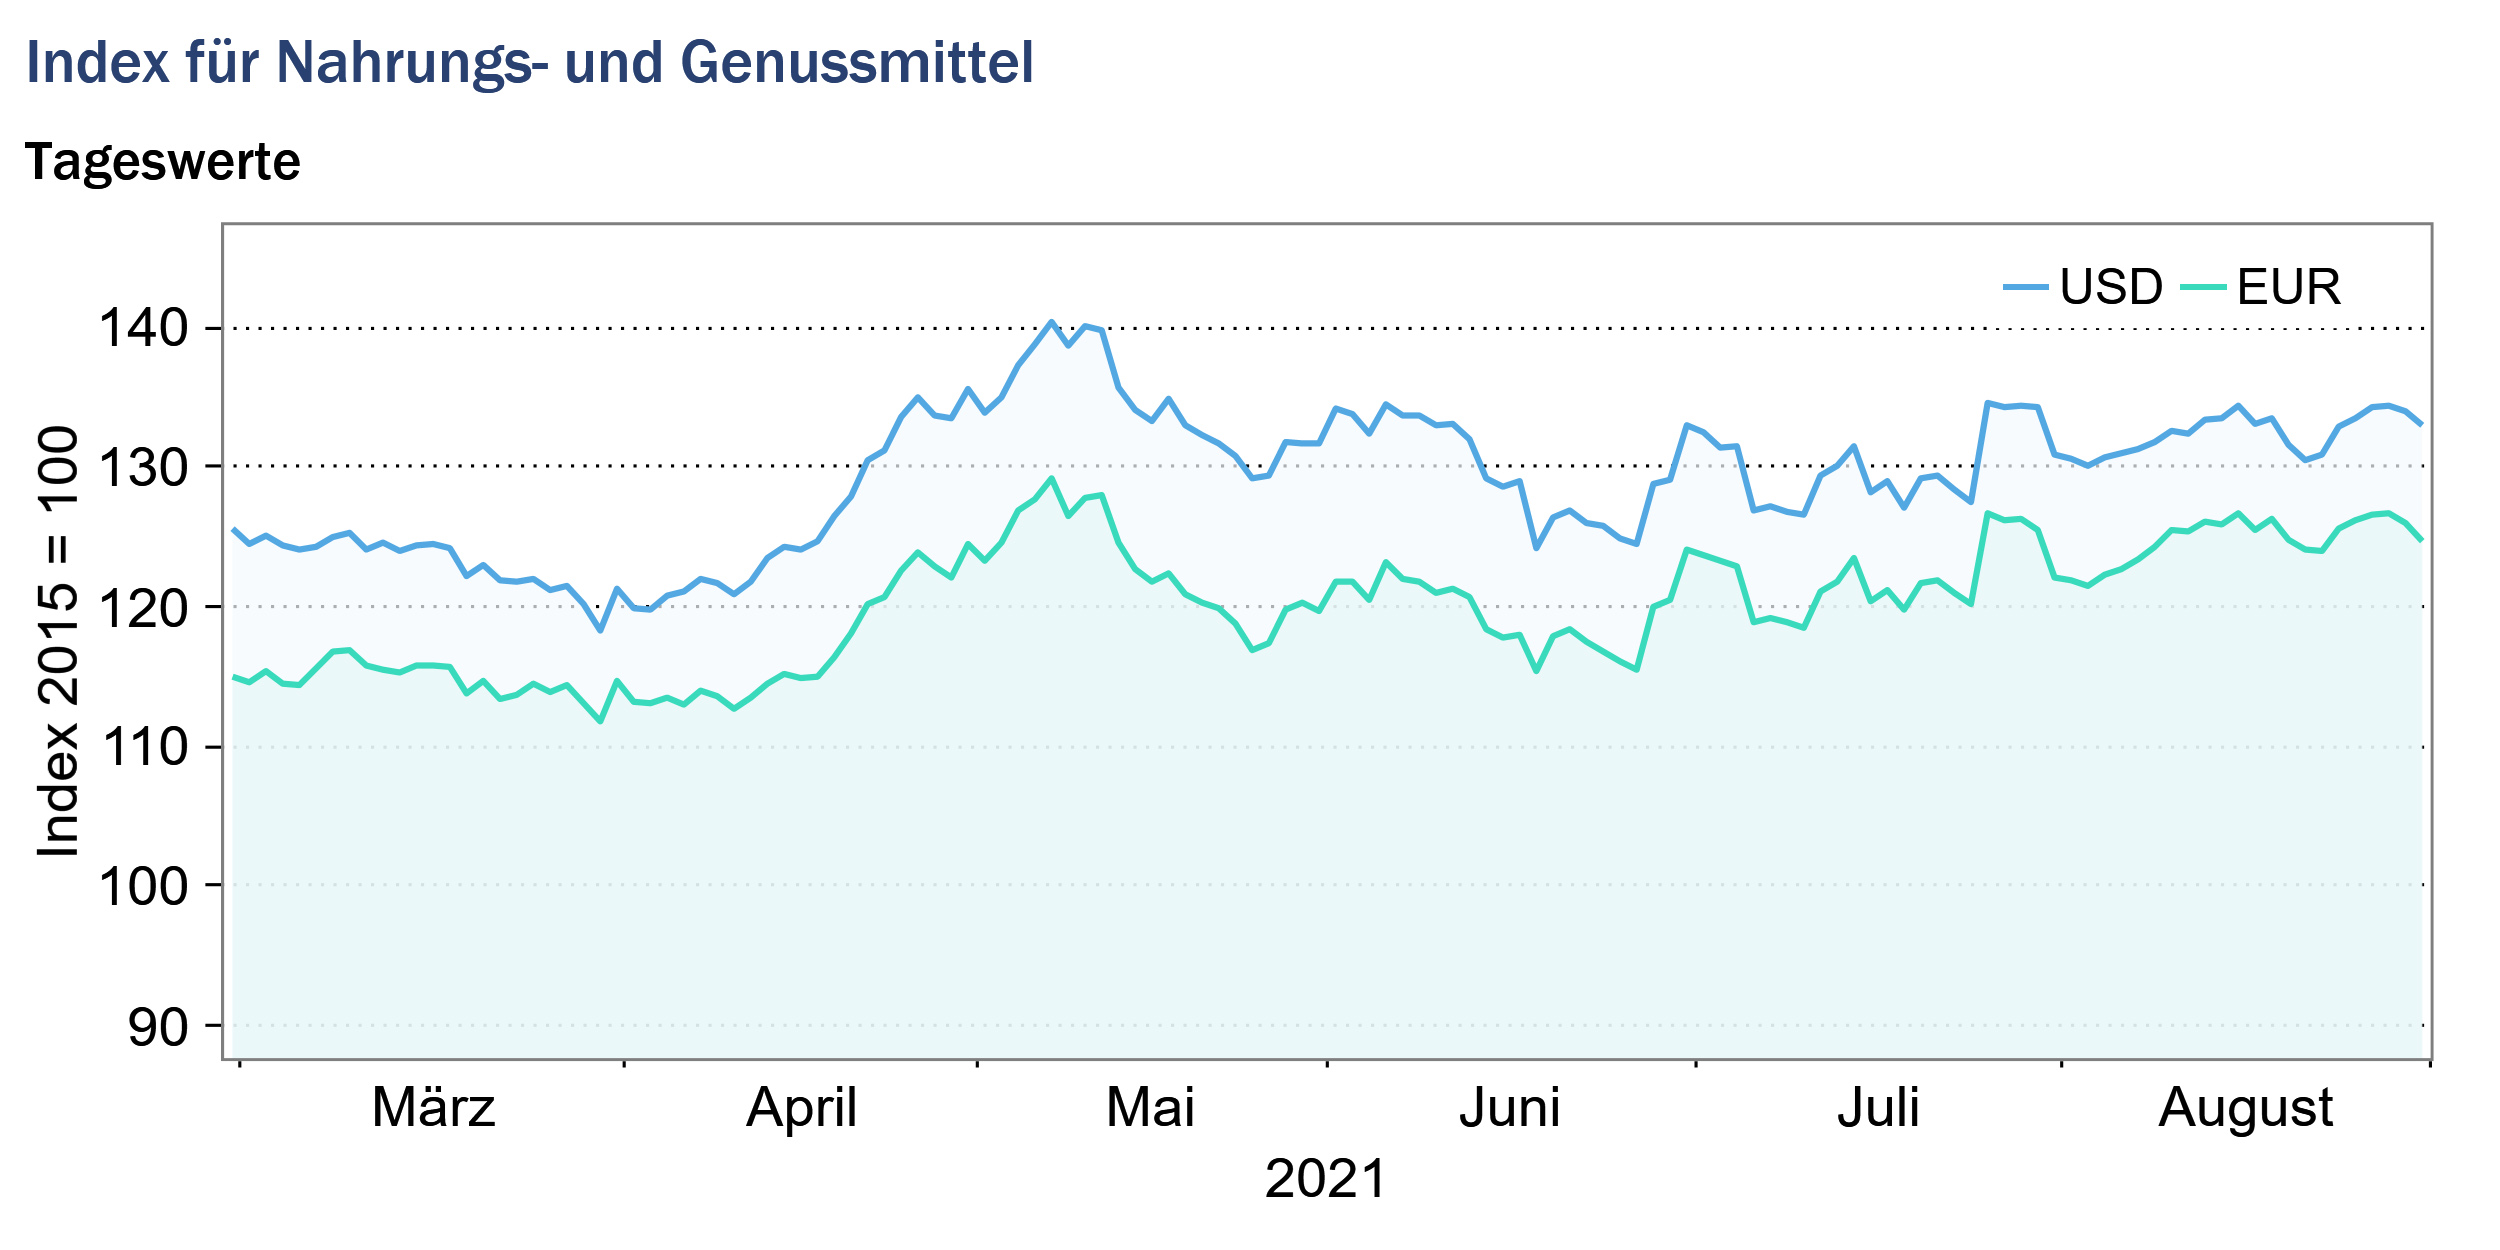
Index for food, beverages and tobacco: + 1.8% (euro basis: + 2.3%)
The index for food, beverages and tobacco rose by an average of 1.8% in August compared with the previous month. The increase was due to developments in the two sub-indices for oils and oilseeds and semiluxury foods. By contrast, the subindex for cereals moved in the opposite direction, falling on average in August.
Corn prices continued to fall in August despite lower crop yields in Brazil and the USA, due to positive production prospects in Argentina, the EU and Ukraine. World rice prices also continued their downward trend in August and remain at historically low levels. By contrast, prices for wheat and barley rose sharply in August compared with the previous month. Increased demand for wheat was met by continued weak supply. European wheat supplies were characterized by quality deficiencies, and North American supplies were weakened by crop failures. Barley prices rose along with wheat prices, as both cereals are important feed grains and thus substitutes.
While palm and sunflower oil prices rose in August, prices on the coconut and soybean oil markets fell. The price of palm oil continued to rise sharply, reaching record levels in August. The price increase was partly due to poor harvest conditions in Malaysia, a major producing country. Lockdown measures imposed due to the Corona pandemic led to a shortage of harvesters, as they were not allowed to enter from Indonesia and South Asia. This delayed harvesting, leading to an increase in pest infestation and a significantly lower crop. In addition, there were failures of palm oil mills in Malaysia and Indonesia.
The sub-index for luxury foodstuffs rose particularly sharply in August compared with the previous month. There were sharp price increases in the markets for coffee, cocoa and sugar. Prices for coffee and sugar were driven by extreme weather conditions in the South American growing regions. A long period of drought was followed by frost, which significantly impacted the harvest in Brazil, the world’s largest exporter of sugar and coffee.
Overall, the food and beverages index rose by an average of 1.8% for the month (euro basis: 2.3%) to trade at 132.4 points (euro basis: 124.8 points).

Source: www.hwwi.org
