HWWI Commodity Price Index Continues to Rise in July
- HWWI overall index rose 4.1% (U.S. dollar basis)
- Crude oil prices increased 1.5%
- Lumber prices fall another 49.2%
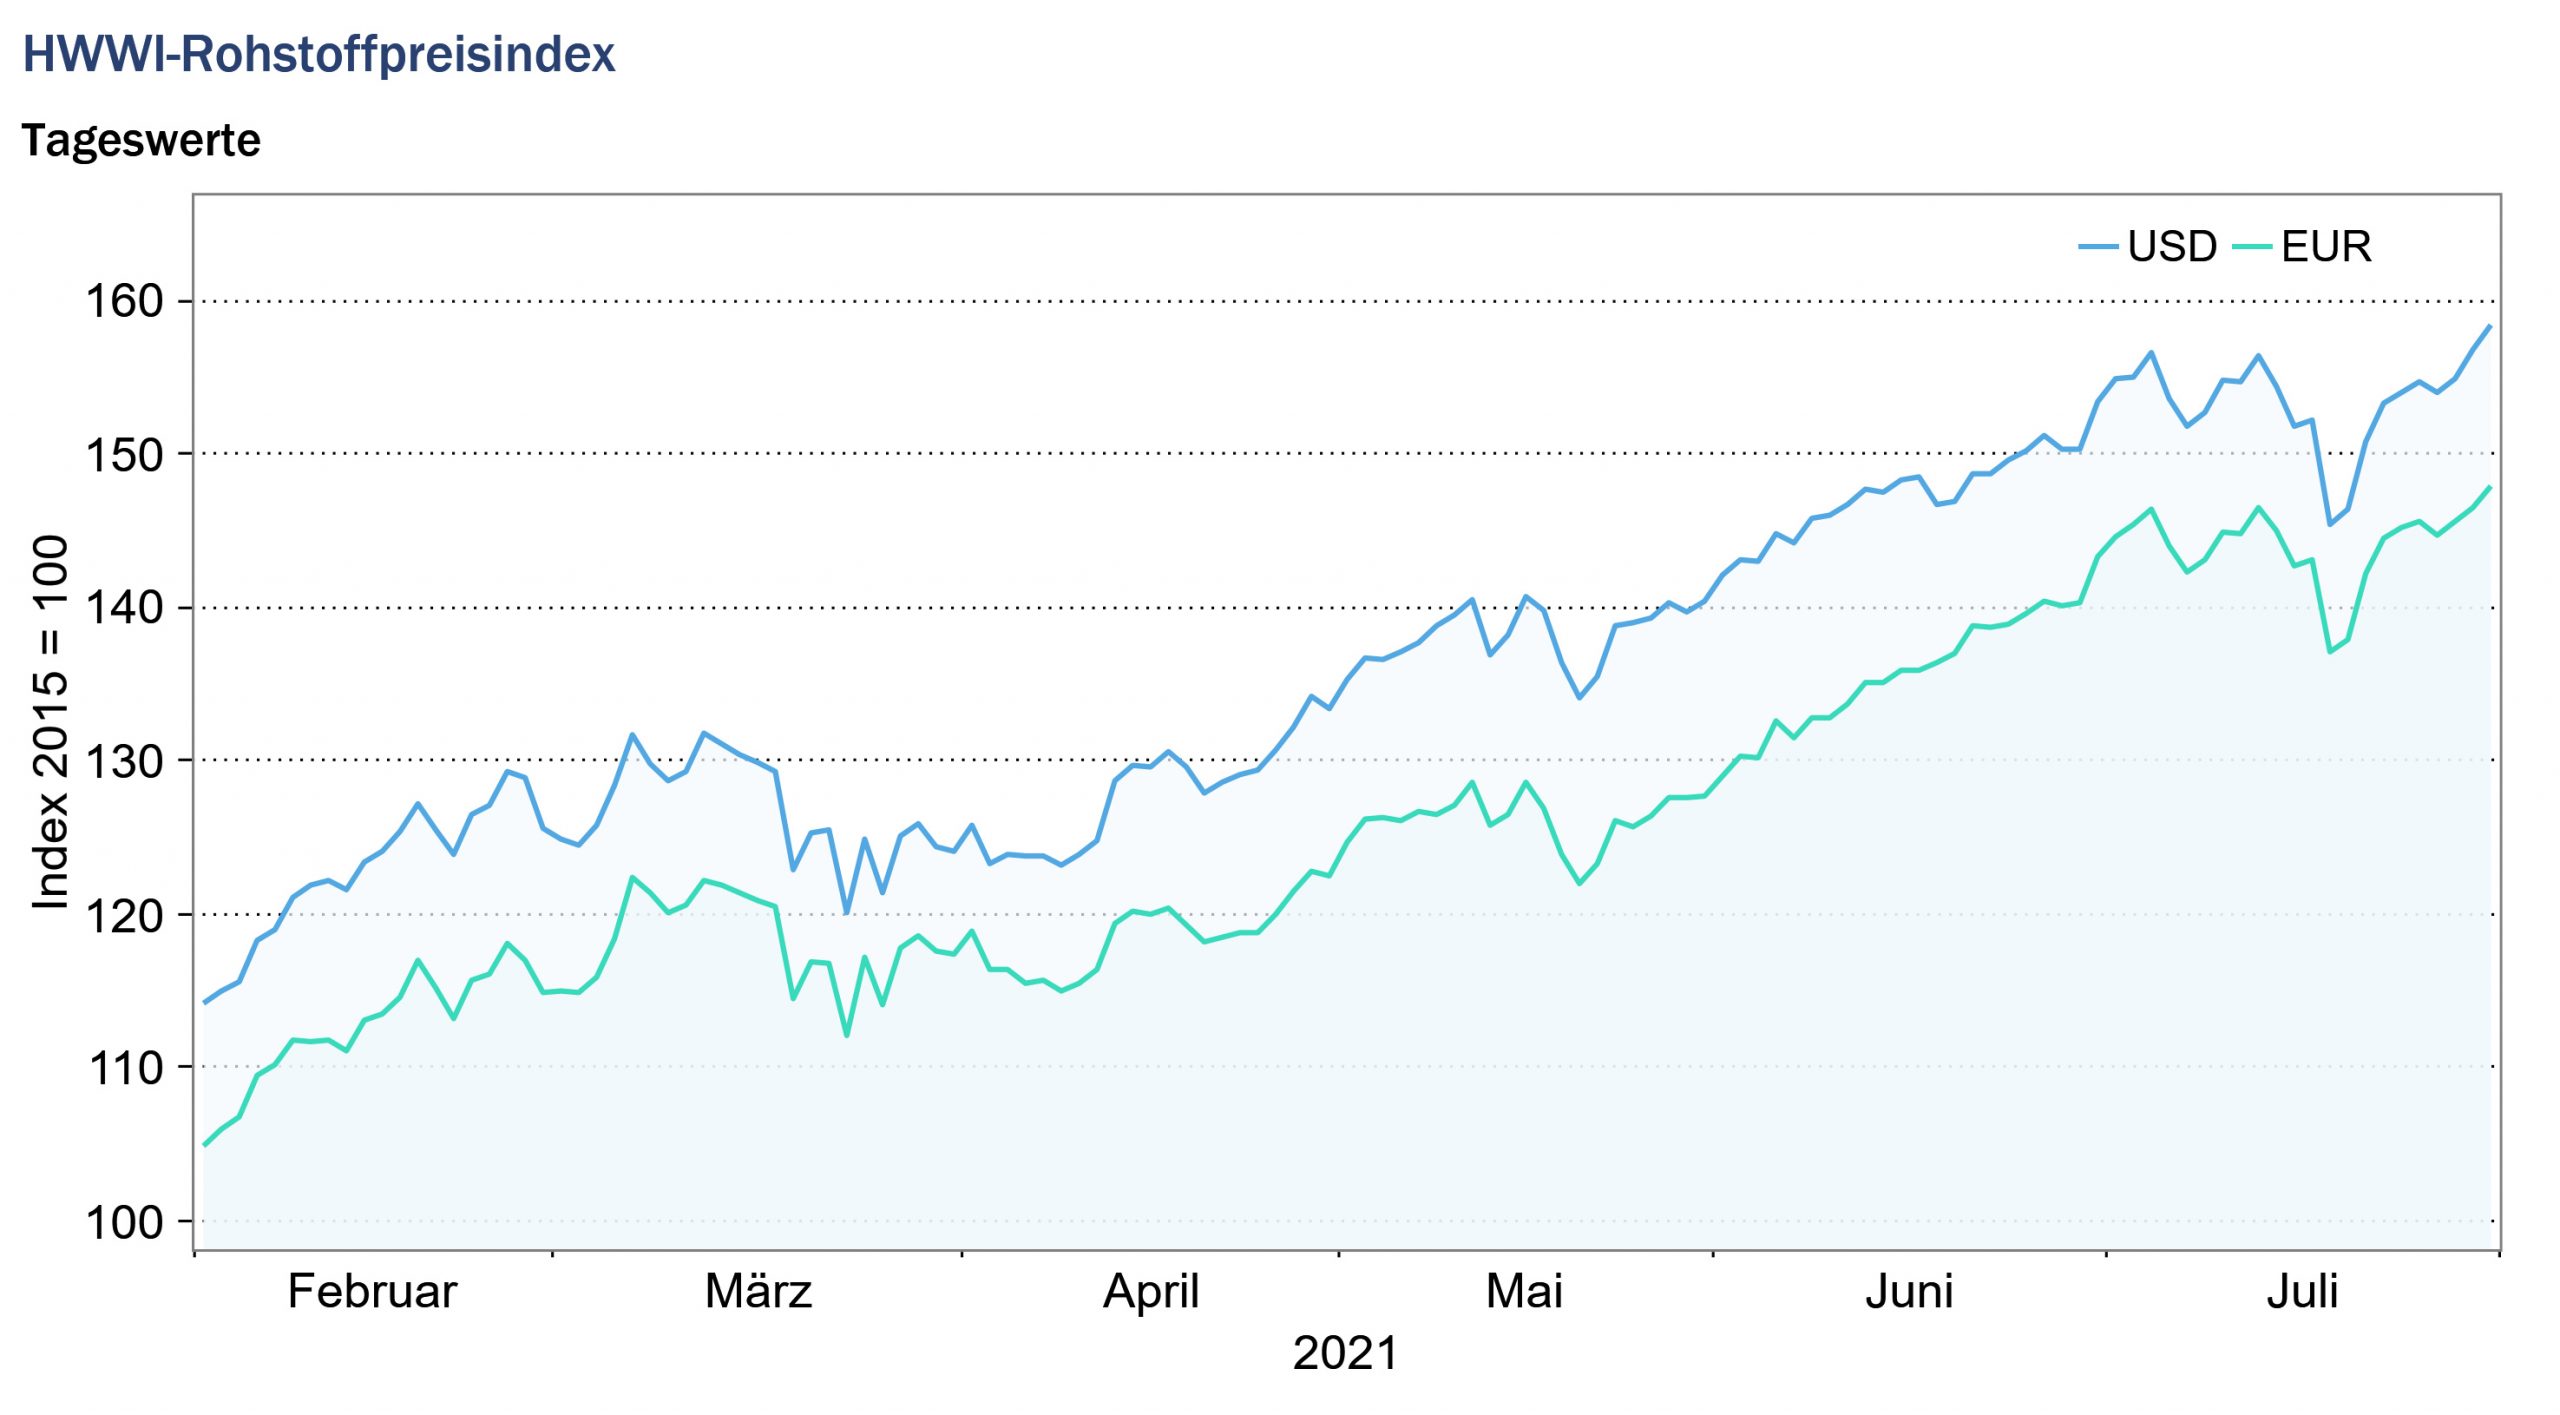
(Hamburg, August 11, 2021) The HWWI commodity price index rose by an average of 4.1% in July from the previous month, exceeding its corresponding year-earlier value by 87.2%. The rise in the overall index in July was again due to price increases in the markets for energy commodities, particularly in the markets for coal and natural gas. On the markets for industrial raw materials, the positive price trend of recent months did not continue in July. In particular, prices for lumber recorded a sharp decline in July. Grain prices also fell on average in July compared with the previous month.

Energy commodities index: +5.6% (euro basis: +7.6%)
Crude oil prices increased slightly on average in July, exceeding the level of the previous month by 1.5%. After a mid-month price decline, prices for European benchmark Brent crude ended the month at $75 per barrel. Prices for US reference grade WTI ended the month at just under $74 per barrel.
The reason for the price drop in the middle of the month was the agreement reached by the members of OPEC+, which provides for a continuous increase in oil supply from August. The production of the OPEC+ countries is to be expanded by 400,000 barrels per day per month. This would lift existing production cuts imposed by OPEC+ in spring 2020 to stabilize prices due to the Corona pandemic in September 2022. In addition, increasing uncertainty due to the global spread of the delta virus variant is weighing on crude oil prices. By the end of the month, however, prices on the crude oil markets had risen again slightly.
The markets for coal continued to record strong price increases in July. While South African coal prices rose by an average of 8.7% month-on-month, Australian coal prices increased by as much as 16.4% on average for the month. As a result, Australian coal prices averaged 179.3% higher in July than in July a year earlier, approaching their 2008 peak for the first time. South African coal prices are also trading at a high level, exceeding their ten-year high in July. Coal prices in July continued to be driven mainly by robust demand from China. Earlier in the year, a drought in southern China led to outages at hydropower plants, which further boosted Chinese demand for coal. In addition, demand for coal is being supported by the current high prices for natural gas. The increased demand is currently encountering a tight supply of coal, caused on the one hand by the interrupted coal production in Indonesia due to the persistent rainfall and on the other hand by the ongoing supply interruptions of coal producers Russia and South Africa. In addition, the trade conflict between China and Australia continues to affect the coal market, as Australia was a major coal supplier to China prior to the conflict.
Natural gas prices also continued to rise sharply in July. While the U.S. natural gas price increased by an average of 16.4% for the month, the price of European natural gas increased by another 29.7% from the previous month. This was the first time the European natural gas price had exceeded its 2005 peak. The significant increase in demand due to the global recovery from the recession triggered by the Corona pandemic continues to be offset by a short supply of natural gas. In Europe, the long winter led to empty inventories, and Russia also supplied less natural gas. In the USA, too, natural gas supplies in July were still below crisis levels, as the drop in prices on the crude oil markets last year also impacted gas production. Natural gas is a byproduct of U.S. shale oil production, some of which has been reduced in response to the drop in prices on the crude oil market.
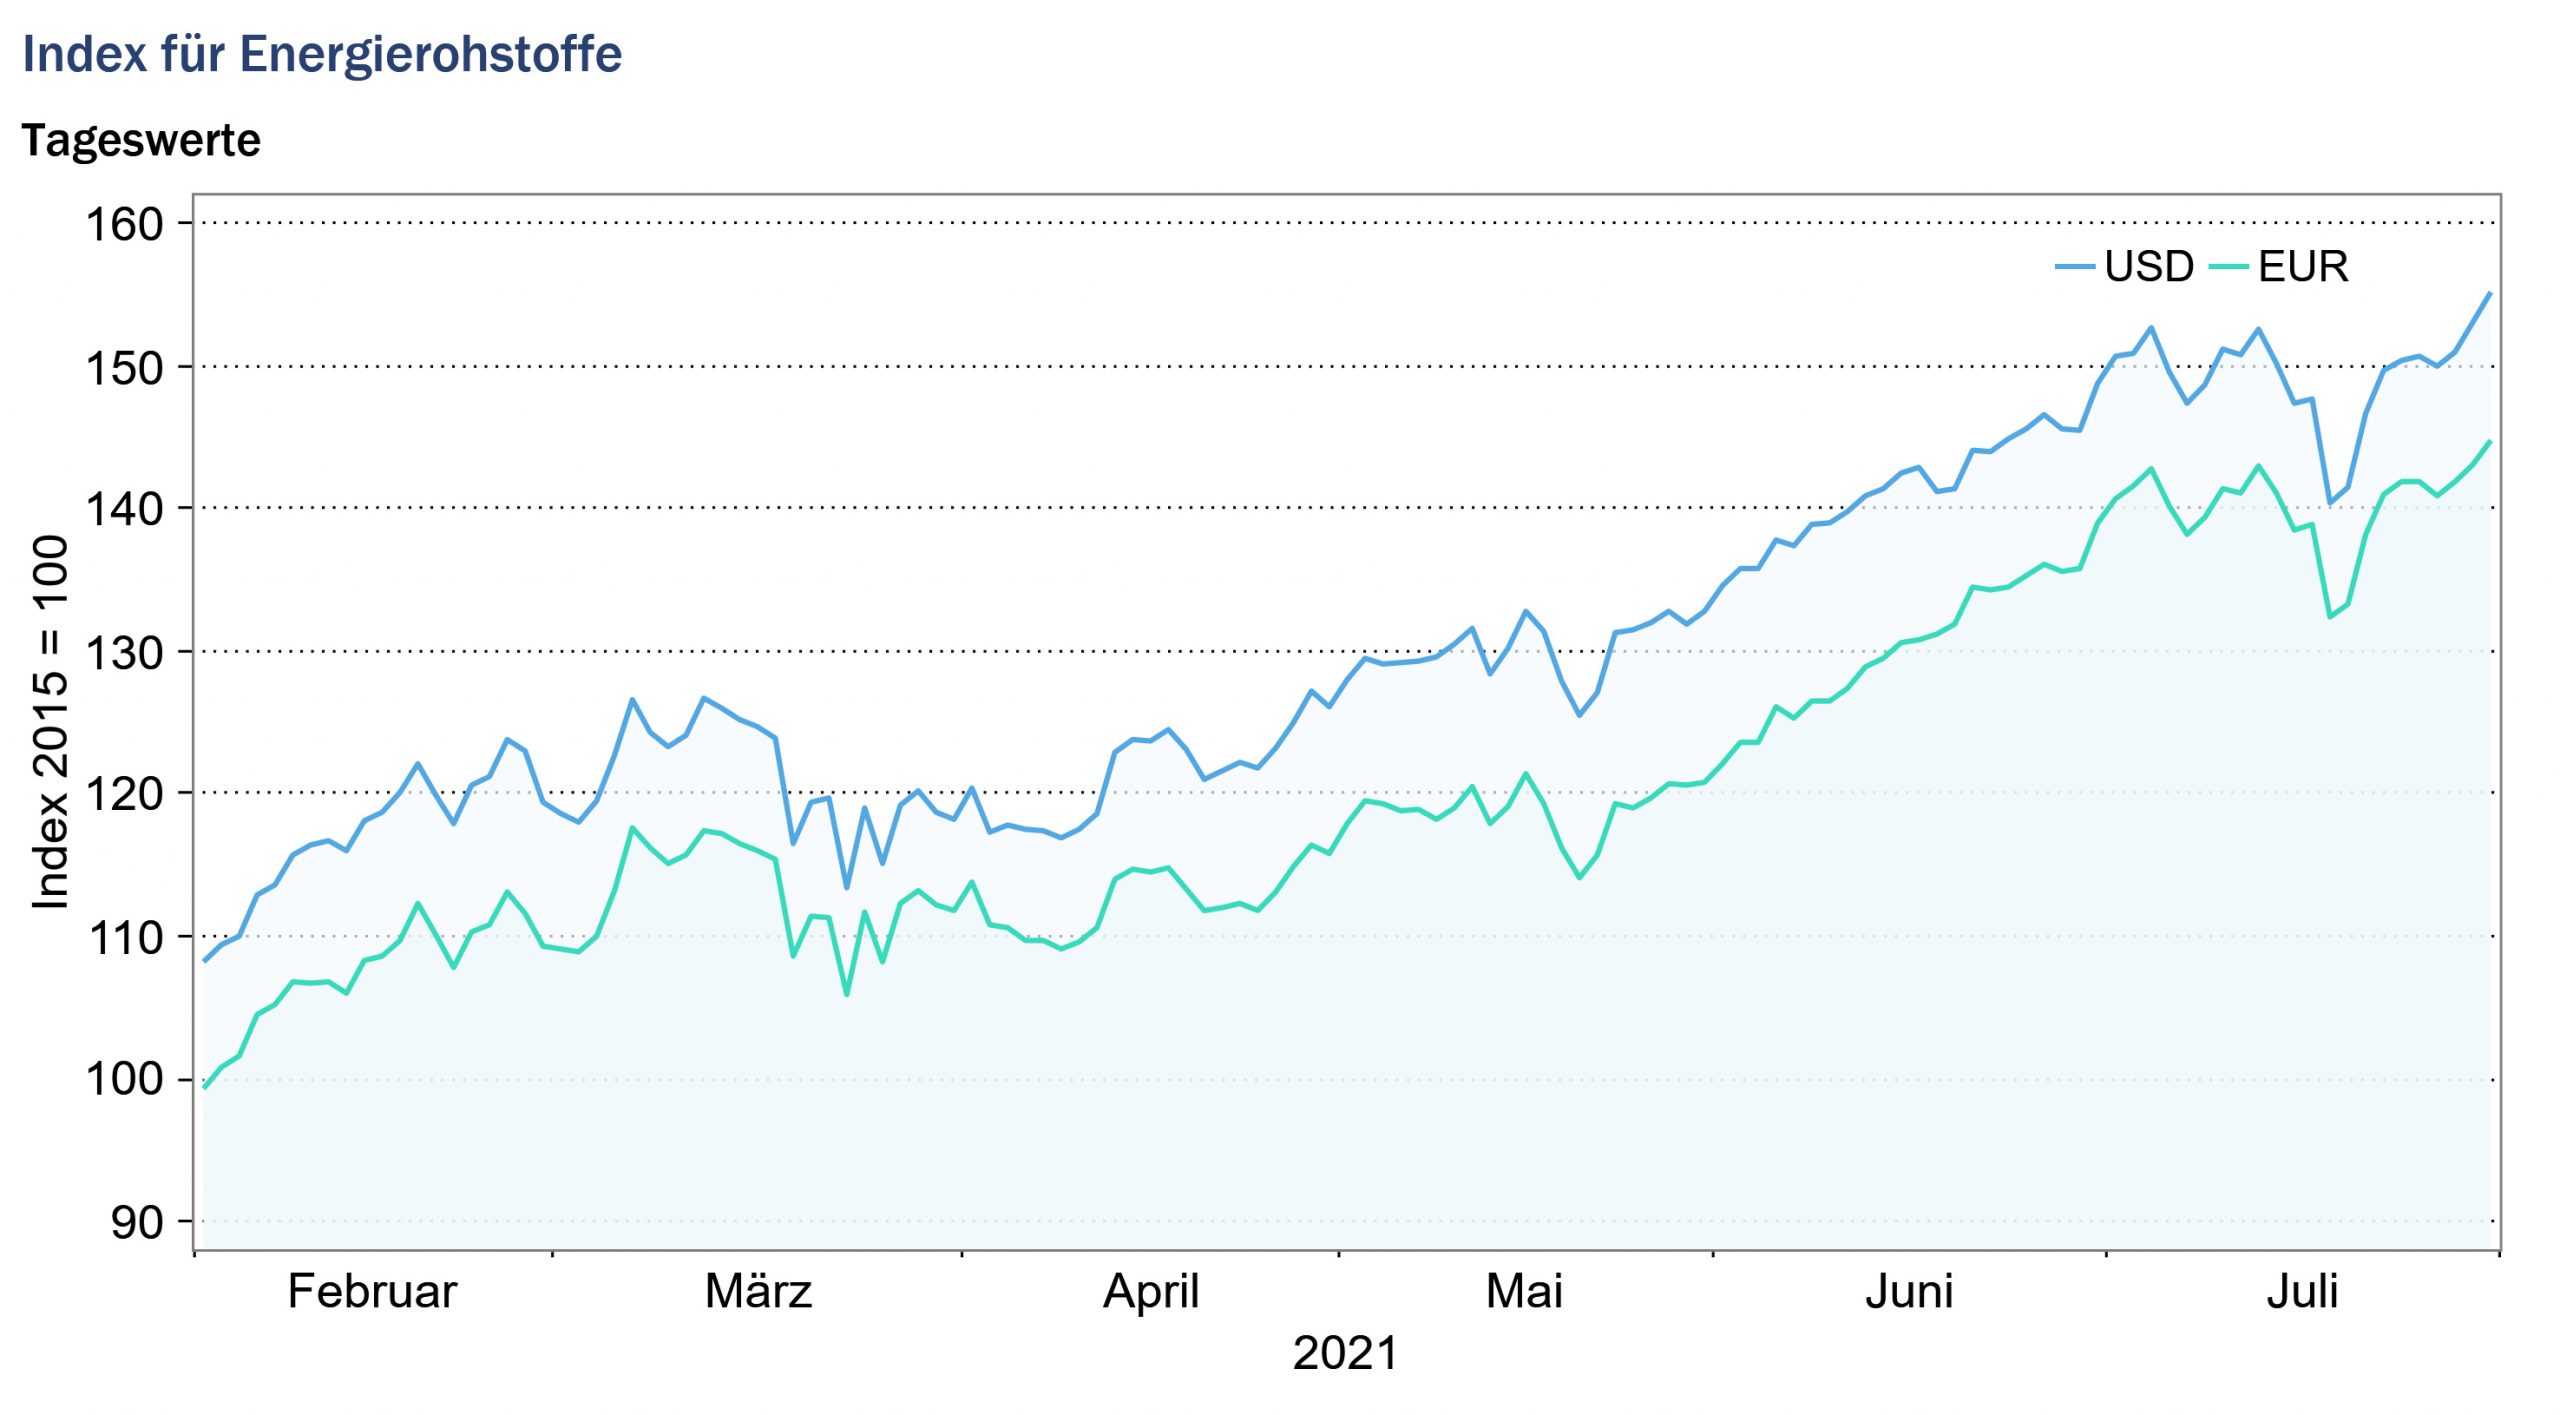
Overall, the energy commodities sub-index rose 5.6% (euro basis: 7.6%) to 149.5 points (euro basis: 140.3 points).

Index for industrial raw materials: – 4.2% (euro basis: -2.3%)
The sub-index for industrial raw materials is divided into the index for agricultural raw materials, the index for non-ferrous metals and the index for iron ore and steel scrap.
The sub-indices for nonferrous metals and iron ore and steel scrap increased slightly on average compared with the previous month. While prices for tin, nickel, aluminum and lead increased in July compared with the previous month, prices for copper and zinc decreased slightly. On the supply side, the price increase on the tin and aluminum markets was partly due to the drought in China. Due to the decline in hydropower production, some Chinese aluminum and tin smelters had to be closed temporarily. In addition to weakened supply, rising demand for aluminum and tin also drove prices. Tin demand benefited from consumer electronics, which have boomed since the global lockdown. The spread of the delta virus variant, which is now also appearing in China, raises fears of renewed supply problems for metals such as tin from Asia.
Copper and zinc prices, meanwhile, fell slightly in July, also responding to uncertainty surrounding rising infection rates in the US, Europe and China and growing concerns about the global economic recovery.
Iron ore prices rose slightly on average in July from the previous month, and steel scrap prices fell slightly. After production interruptions at some mines during the pandemic, iron ore supply is slowly expanding again. Chinese iron ore imports are currently declining as the Chinese government plans to curb steel production in the second half of the year to reduce emissions.
In July, the Agricultural Industrial Commodities Index fell from the previous month, reflecting the huge drop in lumber prices. Lumber prices, which reached highs in May, recorded sharp price declines for the second month in a row. The high prices ensured that sawmill capacity was expanded in the USA, Canada and Europe. Demand, on the other hand, decreased as private construction projects were postponed due to the high prices. The combination of expanded supply and slowed demand caused prices to fall sharply.
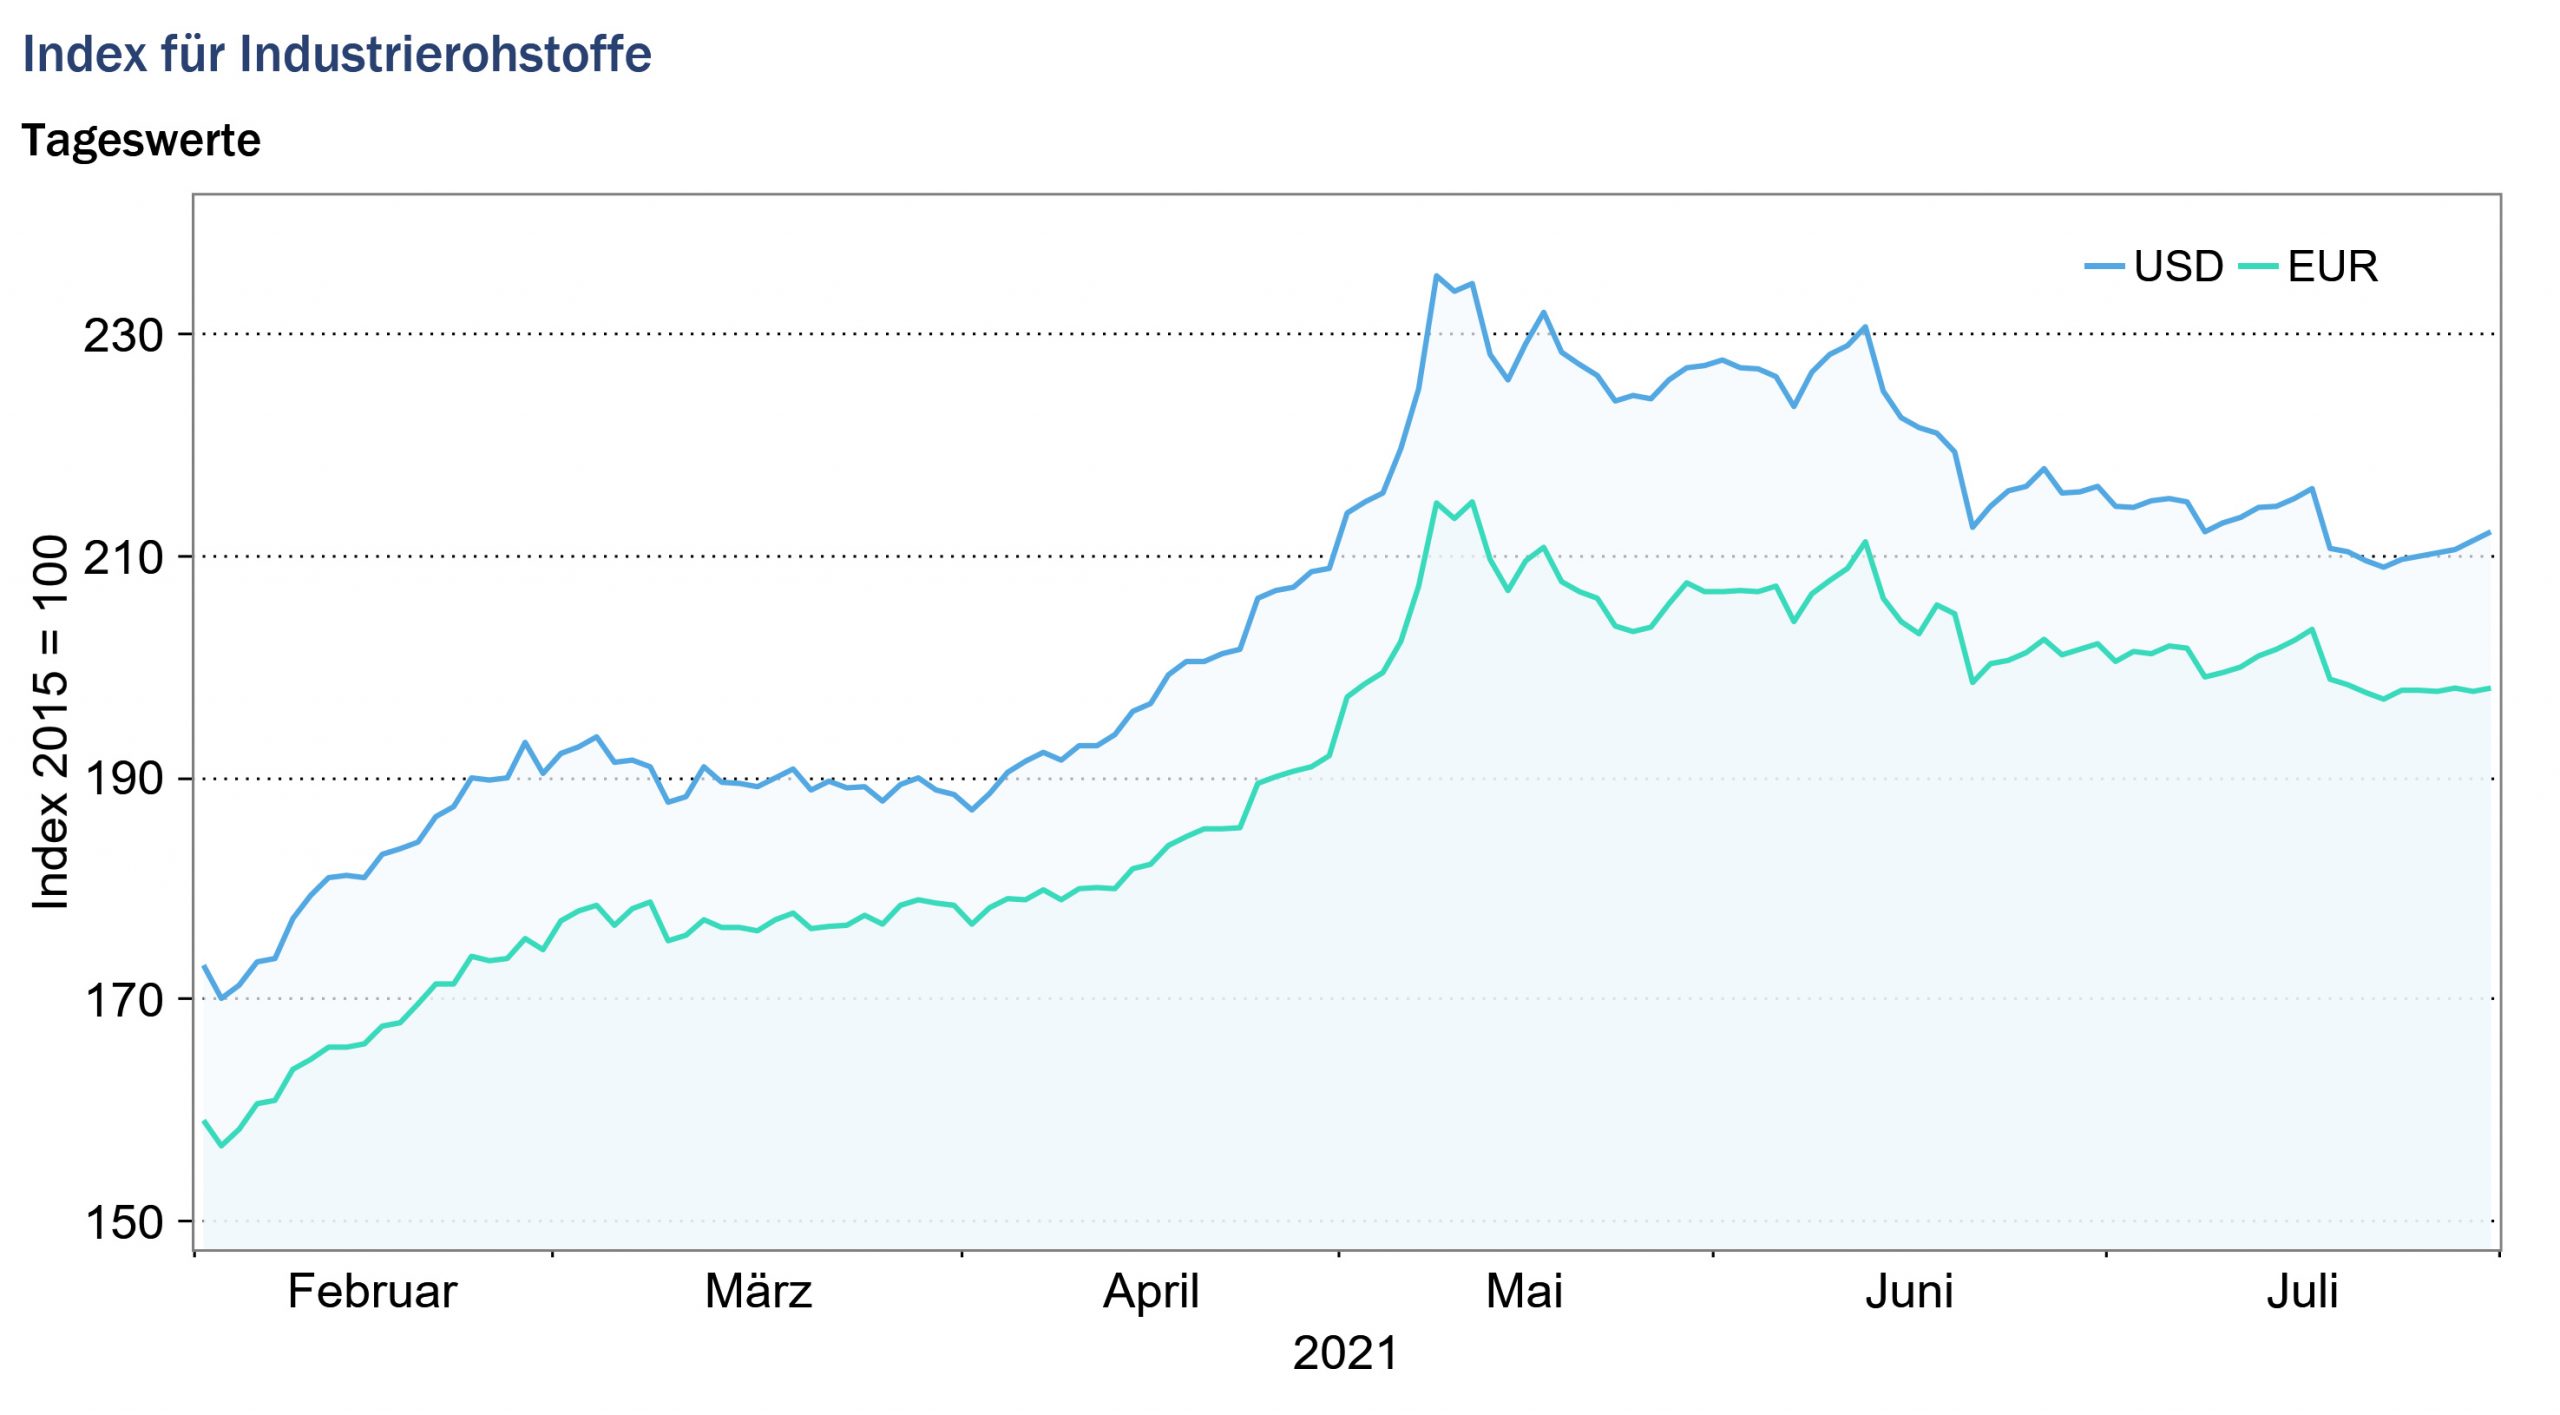
Overall, the industrial commodities index fell by -4.2% (euro basis: -2.3%) to 212.6 points (euro basis: 199.7 points) on a monthly average.

Food and beverages index: +0.1% (euro basis: +2.1%)
The index for food, beverages and tobacco rose by an average of 0.1% in July compared with the previous month. While the sub-indices for cereals and for oilseeds and oils recorded price declines compared with the previous month, the sub-index for semi luxury foods and beverages rose on average for the month.
Grain prices continued to decline in July from the previous month, due to price declines for corn and rice. Corn prices rose due to improved production prospects in the U.S. and Argentina. In addition, China reduced its import orders. Rice prices also fell in response to good crop forecasts and reached a two-year low. By contrast, barley and wheat prices rose on average in July, reflecting concerns about tight supplies in the future due to the current drought in North America and heavy rainfall in Europe.
While prices for coconut and sunflower oil declined slightly, the markets for palm oil recorded price increases. The increased prices for palm oil were due to a tightening of supply from Malaysia and increased demand from India.
The index for luxury foodstuffs increased on average in July compared with the previous month. Coffee and sugar prices increased from the previous month and continued to be affected by unfavorable weather conditions in harvesting regions in July. A prolonged drought was followed by frost in key Brazilian growing regions, which could affect future coffee and sugar harvests. Sugar prices also benefited from stable crude oil prices, as sugarcane is used as a feedstock for biofuel production.
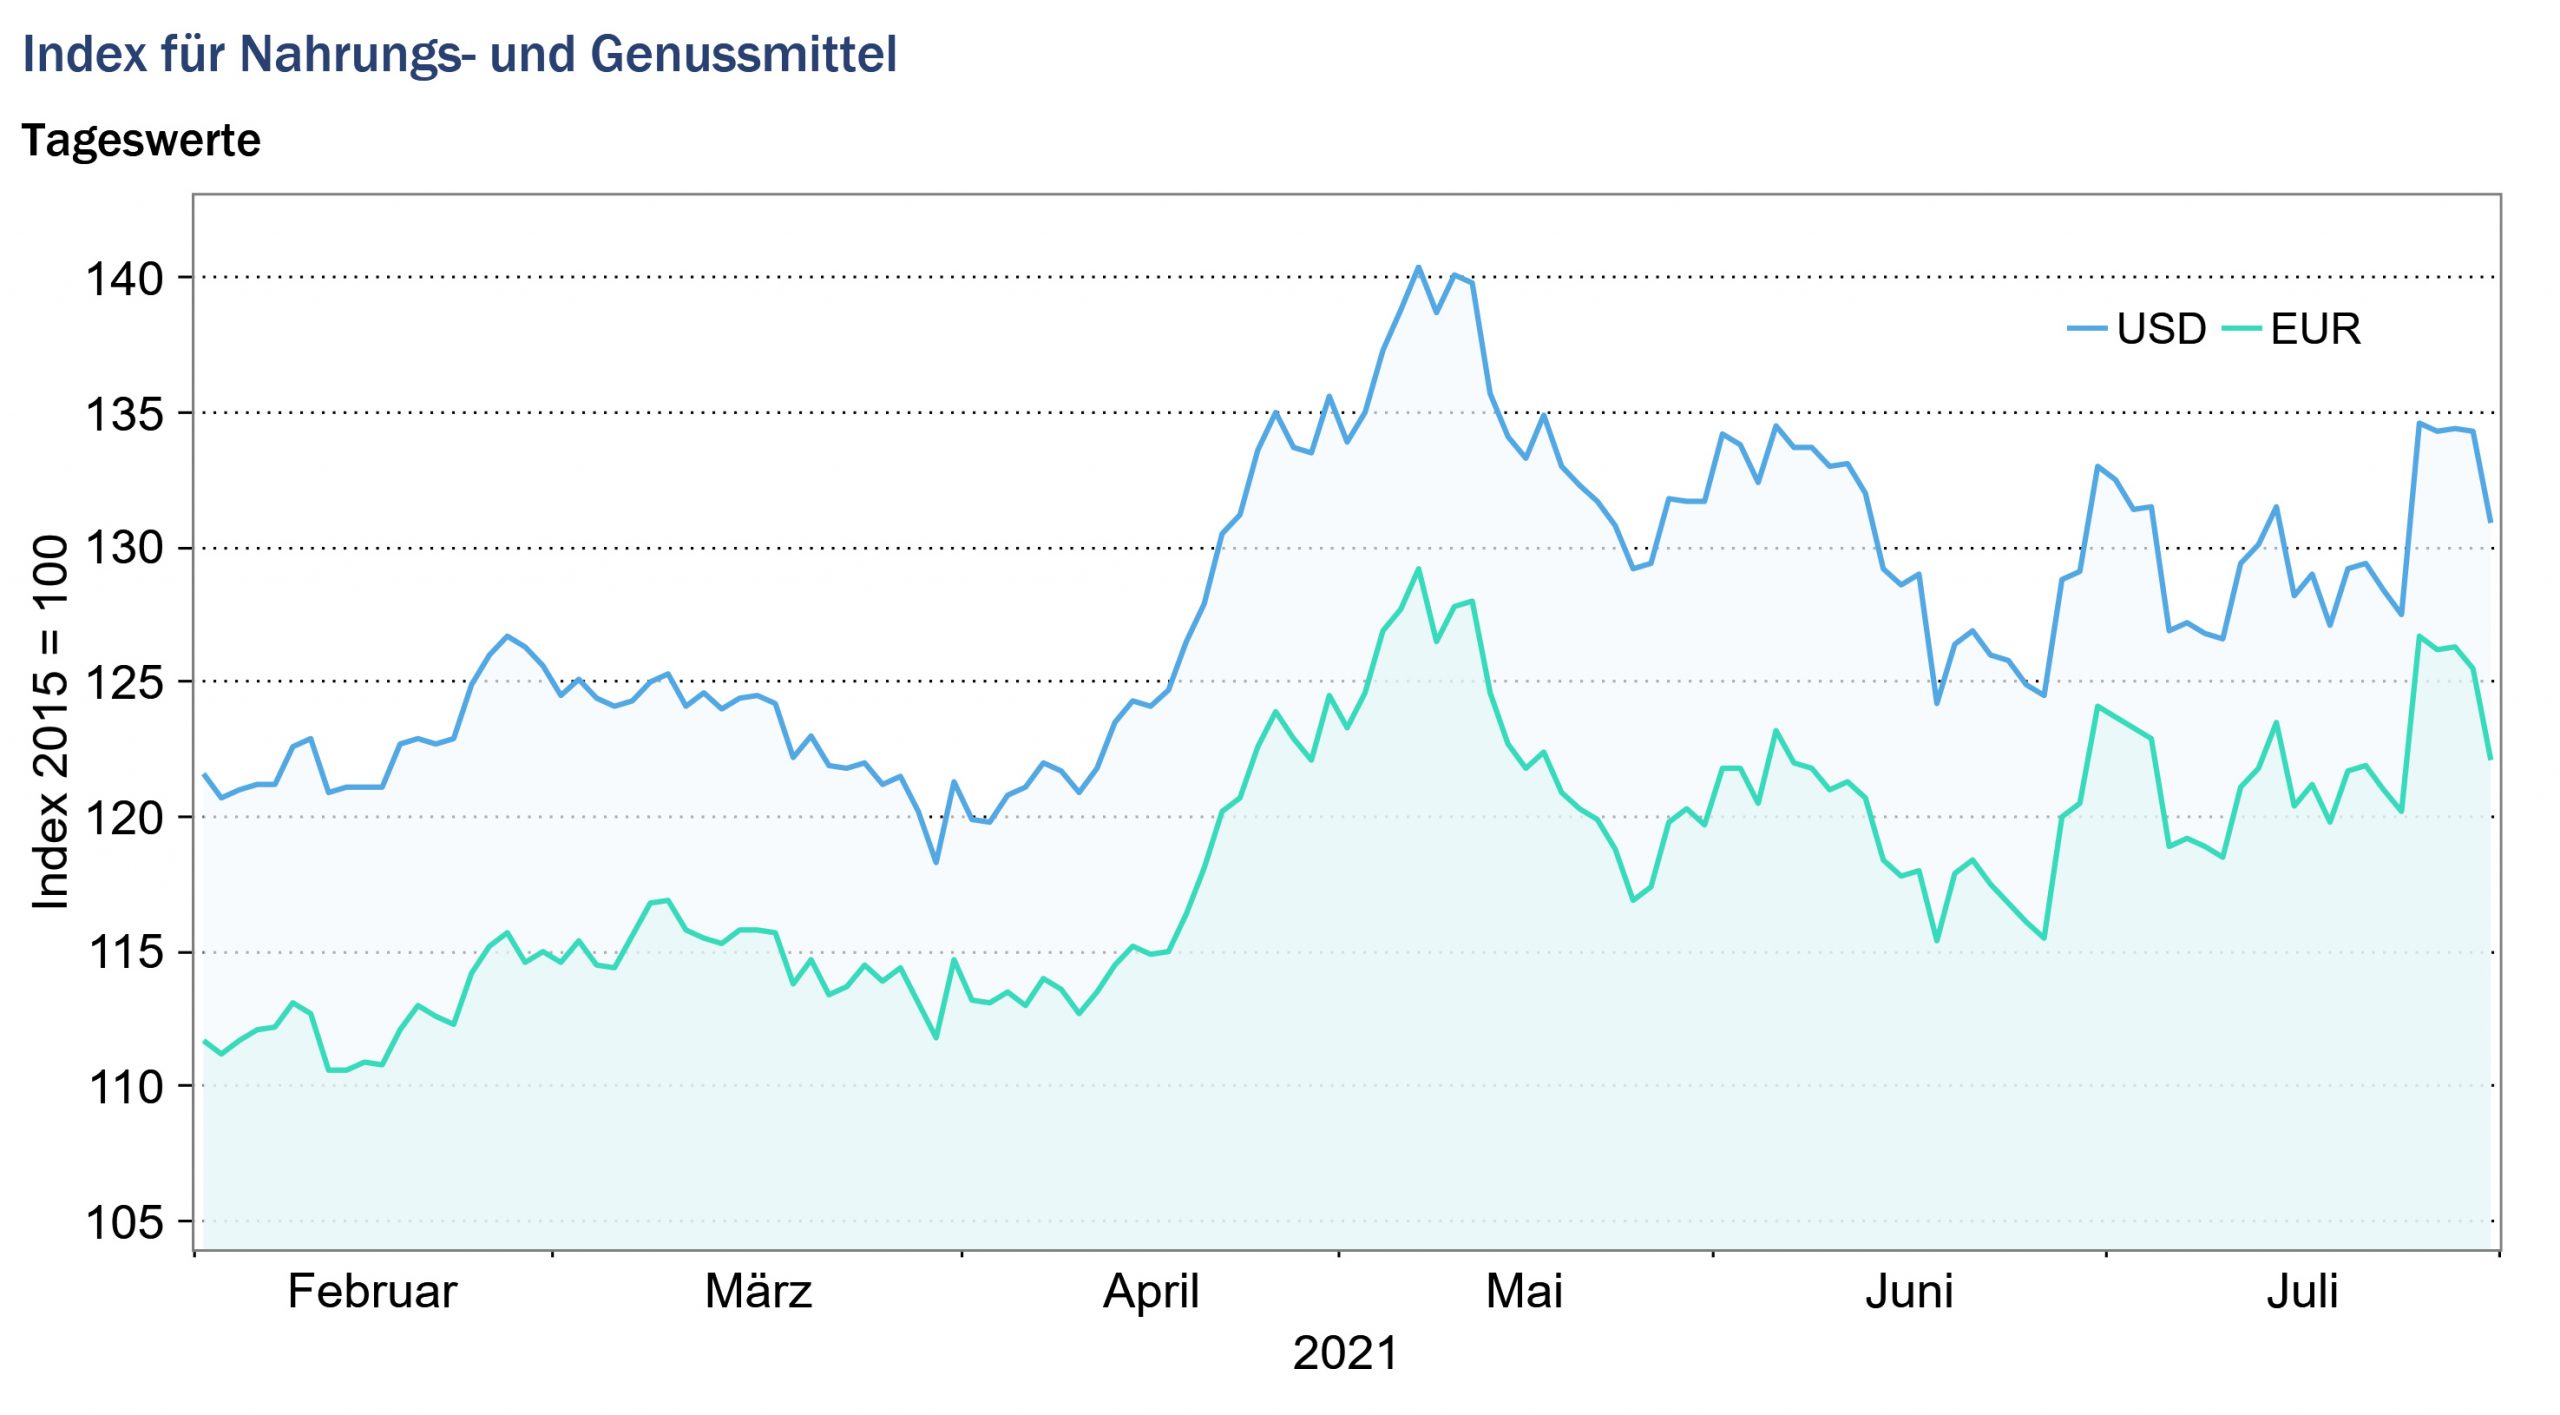
Overall, the food and beverages index rose 0.1% on average for the month (euro basis: 2.1%) to trade at 130.1 points (euro basis: 122.0 points).

Source: www.hwwi.org
